2014 is shaping up to be a tale of two countries. Severe drought slashed hard red wheat production even as cool wet conditions persisted across the Northern Corn Belt and into the Eastern states. Wheat production in three states (Kansas, Oklahoma and Texas) totaled only 342M (million) bushels this year — 40M bushels less than Kansas alone raised just two years ago!
Part 2 is the story of what is shaping up to be record-shattering corn and soybean production. Timely rains throughout June and July have been sufficient from Nebraska to the Eastern Shore, and have even restored hopes for the corn crop in the Southern Great Plains and Texas. The Kansas corn crop was actually rated 64% “good/excellent” as of July 20 and only 7% “poor/very poor.” Early northern field surveys tout the promise of 200-plus-bushel/acre corn in Iowa and Illinois, with the potential for record yields across most states. Soybean yields are made or broken later in August, but the record high 2014 acreage ensures record soybean production at any yield over 40 bushels/acre this year.
Chart 1
USDA used trend-line yields in the July S&Ds, pegging corn production at 13.86B (billion) and soybeans at 3.8B, but what if actual yields are a lot higher? A national yield of 176 on corn, for example, would result in a 14.8B-bushel corn crop!
That sounds far-fetched, but it’s wise to plan for how to manage such volumes — on top of the September 1 stocks.
Rail and barge freight costs are already climbing to record or near record highs for harvest as merchandisers debate yields, and basis has weakened at interior markets. Memories of the weather and railroad nightmares of early 2014 have managers calculating how to set bids to farmers to allow for these freight costs. Some trades for BN cars and shuttles have hit nearly $1/bushel, on top of the actual rail rate(s). Sept/Oct/Nov barge freight is also rising to near-record values, with Illinois River barges quoted to 750/800% of benchmark tariffs, over $1/bushel (Chart 2).
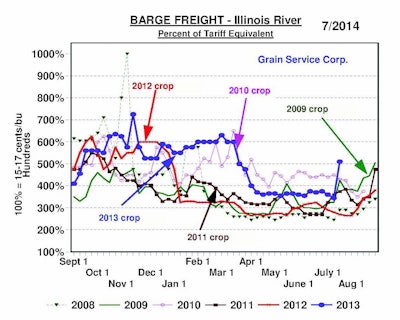
Chart 2
Some elevator managers are in a near panic wondering how to accommodate their farm customers. But setting assumptions and imagination aside, what do statistics show for the harvest of 2014? We analyzed the prospects for 24 states across four regions: Midwest/Plains, Midsouth, East Shore and part of the Southeast. We assumed a 14.8B-bushel corn crop and included the following:
- Projected stocks for each state for 9/1/14, including corn, soybeans, sorghum, as well as new-crop wheat, oats and barley. Estimates are derived from 6/1 stocks less estimated J/J/A disappearance for each state.
- Projected state by state production of corn, soybeans and sorghum using USDA’s June 30 harvested acreage.
- Grain Service projected record or near record yields for each state on corn (14.8B corn total, 176-bushel/acre U.S. average).
- USDA projected average national yield on soybeans of 45.3 bushels/acre for a total of 3.8B bushels.
- On-farm plus commercial storage space as last published by USDA in January 2014.
Significant bin space has been built in the last 12 to 18 months that isn’t accounted for in USDA’s last space statistics, which showed 13.01B bushels for on-farm capacity and 10.4B for commercial storage. Higher storage capacity would only lessen the potential problems, however, so we didn’t worry about trying to estimate the quantity of additional new space. And using a 176-bushel/acre yield on corn should be high enough!
Chart 1 shows the results by state with some startling outcomes. Iowa, for example, should still have around 200M bushels of excess space at the peak of harvest. Indiana, Missouri and South Dakota look to have the biggest potential space deficits this fall. Shockingly, only two states west of the Mississippi River show more grain than space: Missouri and South Dakota. But many other states will be very close to the fall of 2013 in terms of volume vs. space.
Two other important points deserve mention:
1.Exports, feed and industrial usage (crush/ethanol, etc.) consume bushels every day, which serves as the equivalent of “creating” storage capacity.
2.展示一个国家不能有剩余空间ensure the space is always located where the need is greatest.
States that show surplus space on paper can still have ground piles galore. Bushels can arrive faster than dryers can handle them. Some elevators are in areas where on-farm space lags the average, pushing a larger proportion of bushels to commercial space. Areas with the worst space problems can push bushels to surrounding areas, which can also have the effect of depressing basis in surrounding areas.
The potential certainly exists to have the biggest harvest ever, but U.S. agribusiness may be better able to handle it overall than many expect. One fear has been that corn and soybean basis will plummet to extreme low levels and that futures carries will widen to nearly Financial Full Carry. Only time will tell for sure and looking at history can be a risky road map on basis or spreads.
But there are some points to learn from the past. Looking back to prior record crops there have only been three years since 1972 when the Dec/March corn spread traded wider than 80% of Full Carry at any point: 2007, 2008 and 2009. Other big crop years saw Dec/ March typically stay under 75% of FC. What distinguished 2007-09 was high prices at harvest which triggered farm selling and also kept many elevators from holding the large basis ownership they might have been able to finance in years of lower prices. On the other hand, by 2011-13 farmers were used to high prices; $6+ corn didn’t seem an urgent reason to sell, crops were smaller, and space was available. As a result, interior harvest basis stayed well above “traditional” levels.
This harvest, farmers will see the lowest corn price in four years (three years for soybeans). One surprise might be that farmers sell and move their old-crop corn in Aug/Sept to make space, deliver new corn and soybeans on earlier contracts sold at higher prices, and then stop. They might hold off selling more new crop at what they perceive as “cheap” levels and instead try to store everything they can — wherever they can.
Farmers are innovative and will find ways to minimize the need to sell. Look for much greater use of on-farm Grain Bags™ that can hold up to 10,000 bushels in polyethylene “tunnels.” Suppliers report a surge in orders as farmers prepare for these record crops. Many farmers will also use less efficient on-farm space they may not have used in recent years.
Another reason some farmers may opt to wait to sell is that crop revenue insurance with Fall Price Protection will have any payouts determined based on the price of Dec corn futures or Nov soybeans during November.
Corn and soybean basis could bottom early as a result of farmers dodging cheap prices and cheap basis. But corn and soybean forward basis for harvest is unusually strong in some markets close to ports where high freight has less impact and demand is strong. Memphis soybean basis for October is bid +25Nov for example. Exporters are already facing another harvest with enough corn, soybean and soymeal already sold to max out the Gulf loading capacity through year-end.
Overall, look for major logistics problems and cheap basis to dominate again for the Upper Plains region where the BN railroad woes continue and freight costs are highest. But elsewhere, expanding storage capacity, cheap prices, and strong consumptive demand may result in surprisingly short-lived basis weakness this fall despite record crops. One last factor, though, is whether Mother Nature will give us a fast harvest or will rains drag harvest out which allows bins and dryers to absorb the glut. For that one we can only wait.
Hypothetical performance results have certain inherent limitations, and do not represent actual trading. Past results are not indicative of futures outcomes. Trading futures involves risk of loss.


